Last updated: June 2026
B2B demand generation fails when two teams run parallel programmes and call it a strategy. The brand team posts on LinkedIn while the demand team runs ads and sequences, and the two parallel tracks rarely meet. The compounding loop does not start.
The companies that consistently win do one thing differently: they run brand and demand as a single compounding loop.
The dominant belief at many B2B tech companies is that demand generation is lead generation tactics sitting downstream of a separate "brand team." Brand handles awareness while demand handles capture. Each function is measured separately, produces its own activity reports, and there’s no integration between them.
The silo persists because each function cares about their own metrics. Brand teams report share of voice, content engagement, and earned media. Demand teams report MQLs, SQLs, and pipeline contribution. Both reports look healthy on their own, and when the board reads them side by side they see activity from both functions. What is not visible is whether the two units are compounding into a well-oiled engine or anything that produces revenue.
This also reinforces a pattern that keeps showing up across our B2B engagements. Marketing teams produce content, run ads, and send sequences, then end the quarter and can't tell which specific tactic produced the top five deals.
Integration between both marketing function is the solution.
It is a loop, and here's how it works.
Brand investment creates trust and mindshare through high-value content. That increased mindshare lowers the acquisition cost of every paid touch and every cold email that follows. Demand capture engages in-market intent and converts it to pipeline. Revenue from closed deals would justify bigger brand investment, and each spin of the loop makes the next spin cheaper.
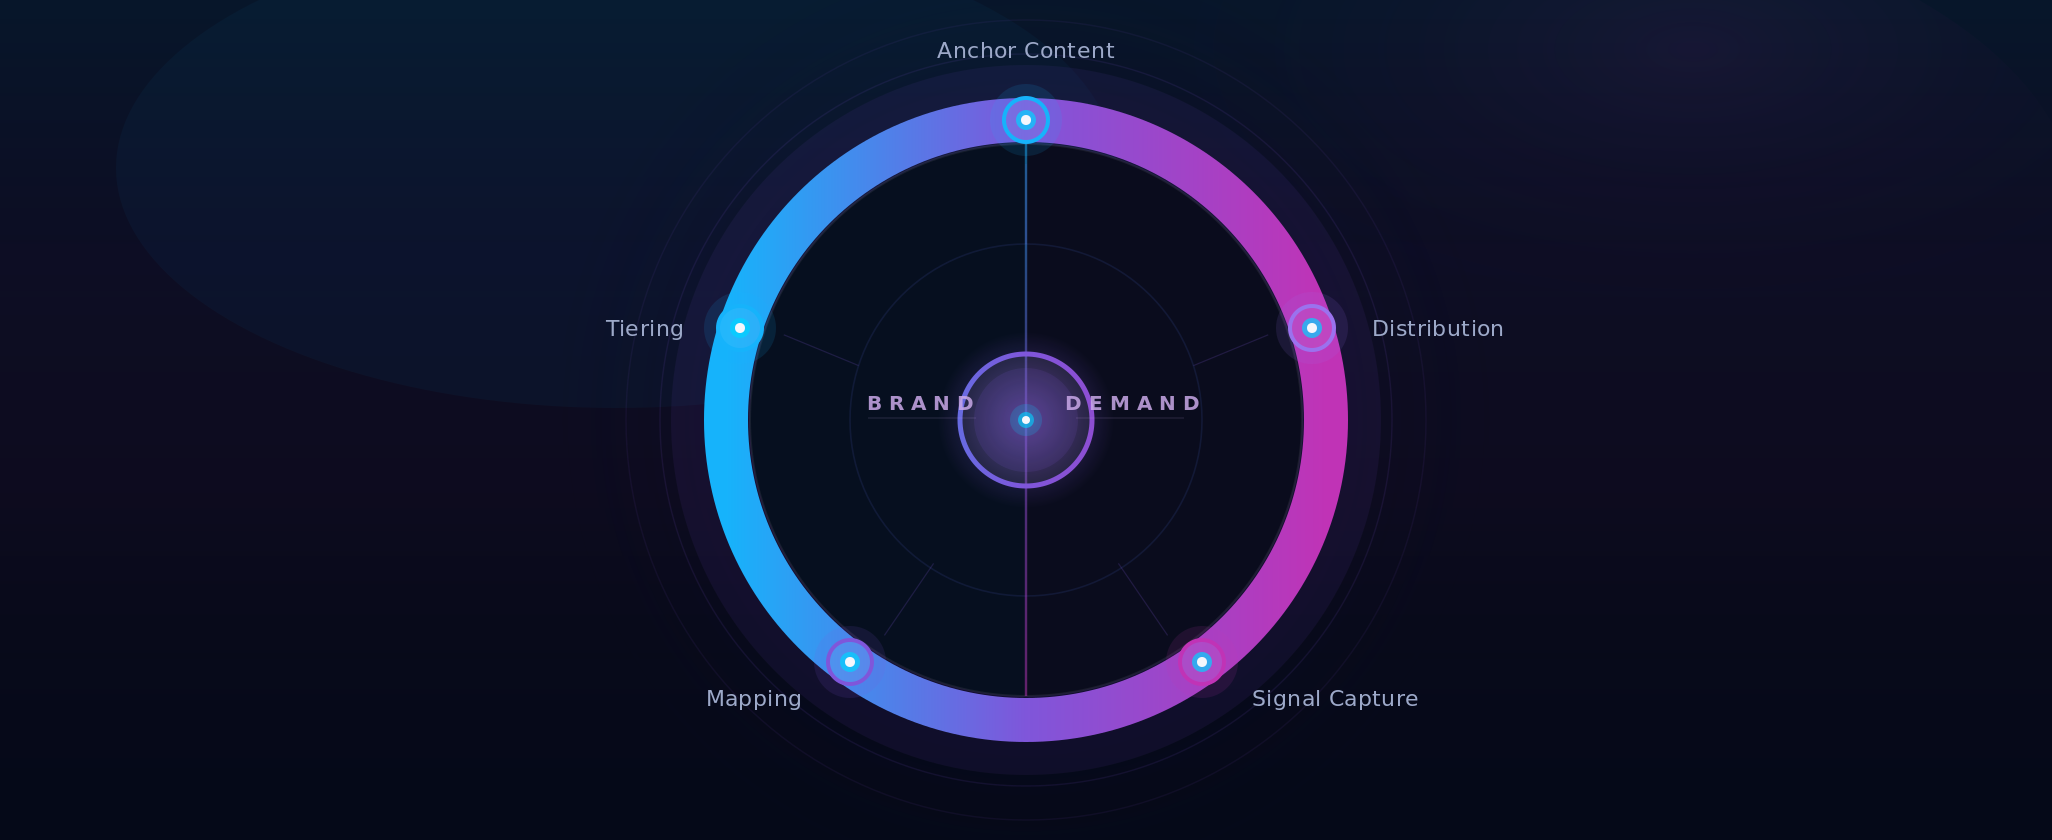
Component 1. ABM tiering (capture readiness). Your TAM gets segmented into ICP. ICP gets tiered across many variables, beyond verticals and demographics. Tier 1 accounts get personalized outreach and full multi-channel pursuit. Tier 2 gets a lighter cadence. Tier 3 is automated. Tiering is the difference between random spray and orchestrated effort.
Component 2. Buying committee mapping (multi-thread). Gartner reports 6 to 11 people in a B2B buying decision. Unfortunately the CRM rarely has all of them. Mapping them all is what makes the engine multi-threaded instead of single-threaded.
Component 3. Anchor content (the brand engine). One or two heavy assets per quarter. Original research report, definitive guide, benchmark assessment, recurring webinar series. Pick the format your ICP actually consumes. The strongest demand happens when you create the category in the buyer's head before you ask them to buy.
Component 4. Strategic distribution (the bridge). The asset has to reach the right people with the right distribution plays. Could be LinkedIn and Meta ads tied to ICP-fit accounts. Outreach into the buying committee. Newsletter and podcast distribution where it fits. Boils down to your audience preferences and behaviour.
Component 5. Signal orchestration with phone follow-up (the capture). Every engagement with the anchor content is a signal, and every signal triggers a multi-channel follow-up within 24 to 48 hours. In a feed saturated with automated emails and LinkedIn spam, the phone call is the differentiator.
Connect all five and the flywheel spins. Disconnect any one component and the loop breaks.
I spent 4.5 years building the marketing engine at Cylindo. The main demand generation and capture system ran on two to three original research reports per year. Each report did three jobs at once.
On the brand side: the report earned market authority. Furniture brands started thinking about visual commerce challenges through our framing. We owned the category narrative.
On the demand side: the entire buying committee pulled the report at the top of the funnel. Senior buyers self-identified at the bottom by requesting calls because they were already convinced of the thinking before the first conversation started.
Inbound conversations moved significantly faster than deals through outbound. Senior buyers arrived already sold on the worldview. Sales picked up where the content left off.
Enhance XR came to us with a differentiated 3D product visualization product and a fragmented marketing approach. They were posting content, running some ads, and doing occasional outbound, but the pieces existed in parallel without any integration that would make them compound.
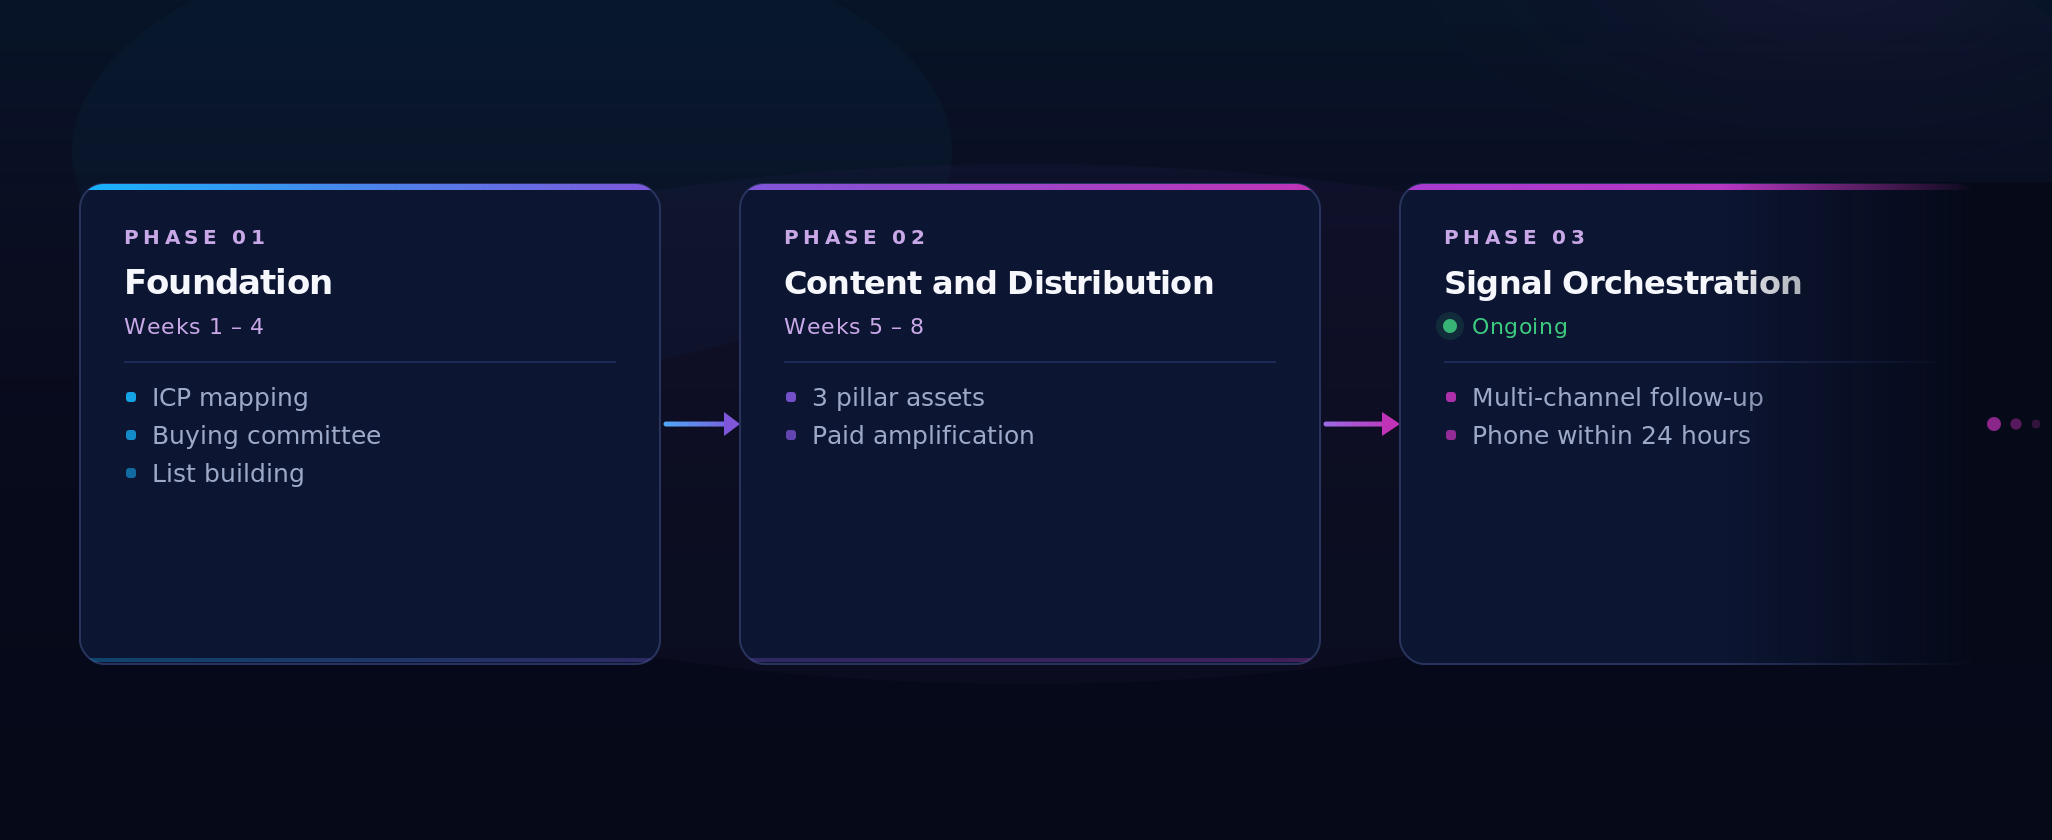
We built the flywheel in three phases over 8 weeks of setup, then ran the engine.
Foundation phase, weeks 1 to 4: ICP mapping, buying committee identification, company list building with Apollo, Ocean.io, Fullenrich. Tier 1 to 3 segmentation across key markets.
Content and Distribution phase, weeks 5 to 8: three pillar assets. The 2025 Furniture Commerce Playbook (awareness anchor). Winning with Tech in Furniture Retail guide (consideration). The 10 Visual Trust Signals assessment (diagnostic). Each pillar served as brand and demand asset. Strategic distribution via LinkedIn and Meta with weekly optimization.
Signal Orchestration phase, ongoing: every signal triggered a multi-channel follow-up. Personalized email, LinkedIn message, phone call within 24 hours. The phone component was the differentiator.
The numbers across 9 months: 1100+ qualified signals, 110 meetings booked, and pipeline growing month over month. Show-up rates climbed after we implemented a no-show playbook. Sales cycles shortened because prospects arrived pre-educated.
The integration between brand-side anchors and demand-side capture is what made the flywheel spin, and each spin made the next one cheaper. Sales cycles shortened because prospects arrived pre-educated, and the same content carried three jobs (brand authority, lead capture, pipeline acceleration) in one connected system.
Five moves to start the flywheel.
1. Tier your TAM. TAM segments into ICP. ICP tiers into 1, 2, and 3 by revenue fit, ICP fit, account engagement, signal-stack and timing signals. Tier 1 gets pursued. Tier 2 gets nurtured. Tier 3 is automated. The 12 Symptoms of Random Acts of Marketing guide includes a diagnostic for spotting the moments when this tiering is missing.
2. Map the buying committee. Champions, economic buyers, blockers, influencers, technical evaluators. Track their engagement patterns across the anchor content and all other relevant first-party and third-party signals.
3. Pick your anchor format. Webinar series, original research report, definitive guide, benchmark assessment. Pick the format your ICP actually consumes. Commit to one or two anchors per quarter. The hamster wheel of daily content production is the failure mode you are trying to escape.
4. Build the distribution rhythm. Strategic paid amplification on LinkedIn and Meta tied to your ICP-fit accounts. Outreach into the named buying committee for each Tier 1 account. The asset has to reach the people.
5. Capture every signal with a 24 to 48 hour response window. The follow-up has to run multi-channel (email, LinkedIn message, phone call) because the signal decays fast and the phone call is what cuts through the saturation in a Series A buyer's inbox.
Connect all five and the flywheel starts.
The flywheel breaks when any of the five components is missing. Three or four broken components at once produces a condition where your team is busy, but can't produce the forecasted sales pipeline. The 12 random acts of marketing symptoms guide gives you a diagnostic that's easy to read. Count how many are firing in your team right now. If three or more, your flywheel is likely broken.
If instead of reading a guide, you enjoy more interactive and visual way for a diagnostic, run the GTM Scorecard and find your gaps in 3 minutes.
Demand generation fails when brand and demand operate as separate functions. The brand team produces content while the demand team runs capture tactics, both report on activity, and neither owns the integration between them. The result is high effort and low pipeline because the two halves never compound. The fix is to run them as one flywheel, where anchor content earns trust, signal capture engages in-market intent, and revenue from closed deals justifies bigger content investment in the next cycle.
Brand investment creates trust and mindshare, while demand generation captures in-market intent and converts it to pipeline. The split is useful at Fortune 500 scale where teams are big enough to specialise, but at Series A it becomes a trap because it pushes the two halves apart. Brand and demand should run as one engine, one team, one set of metrics, and the integration is what produces compounding pipeline.
Three connectors. Strategic distribution puts the content in front of the right ICP accounts. Signal capture triggers a multi-channel follow-up within 24 to 48 hours of any engagement, ideally including a phone call. Buying committee mapping engages 6 to 11 personas per Tier 1 account, not just one. Without the three, thought leadership becomes brand exhaust. With them, it becomes the cheapest form of demand capture you can run.
ABM tiering segments your TAM into ICP, then ranks accounts within ICP: Tier 1 (high-fit, high-revenue, high-intent), Tier 2 (medium), Tier 3 (low). Tier 1 gets personalised multi-channel pursuit, Tier 2 a lighter cadence, Tier 3 automation. Tiering is the difference between random spray and orchestrated effort. The criteria depend on your business: revenue band, vertical, technographic fit, recent funding, role changes, and third-party intent signals.